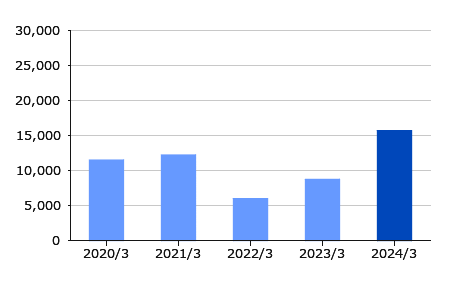
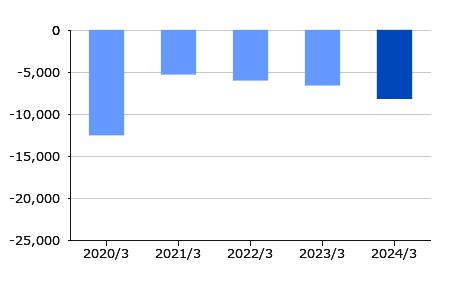
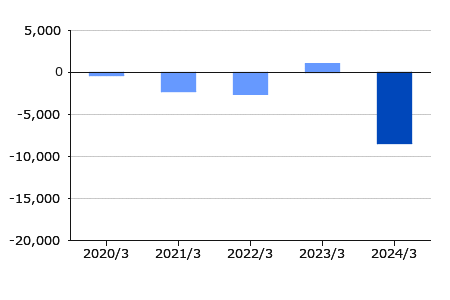
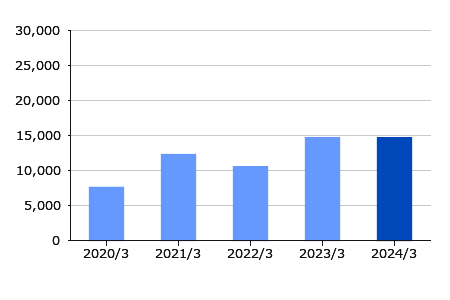
Management Index (Cash flows)
Consolidated
(millions of yen)
| 2020/3 |
2021/3 |
2022/3 |
2023/3 |
2024/3 |
|
|---|---|---|---|---|---|
| Cash flows from operating activities | 11,484 | 12,211 | 5,972 | 8,725 | 15,665 |
| Cash flows from investing activities | -12,406 | -5,174 | -5,888 | -6,478 | -8,056 |
| Cash flows from financing activities | -358 | -2,266 | -2,565 | 1,016 | -8,449 |
| Cash and cash equivalents at end of period | 7,584 | 12,278 | 10,520 | 14,696 | 14,653 |
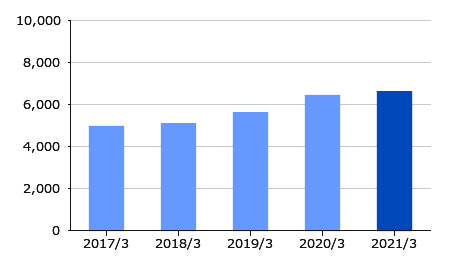
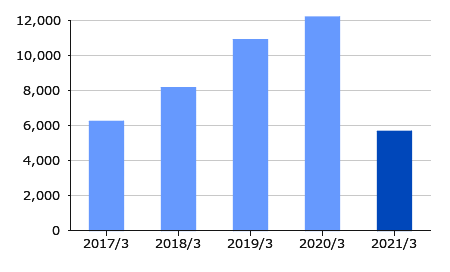
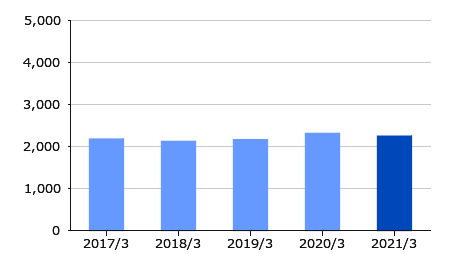
(単位 : 百万円)
| 2017/3 |
2018/3 |
2019/3 |
2020/3 |
2021/3 |
|
|---|---|---|---|---|---|
| 減価償却費 | 4,952 | 5,072 | 5,601 | 6,427 | 6,608 |
| 設備投資額 | 6,236 | 8,153 | 10,896 | 12,200 | 5,668 |
| 研究開発費 | 2,178 | 2,123 | 2,155 | 2,312 | 2,246 |