

Environmental Conservation
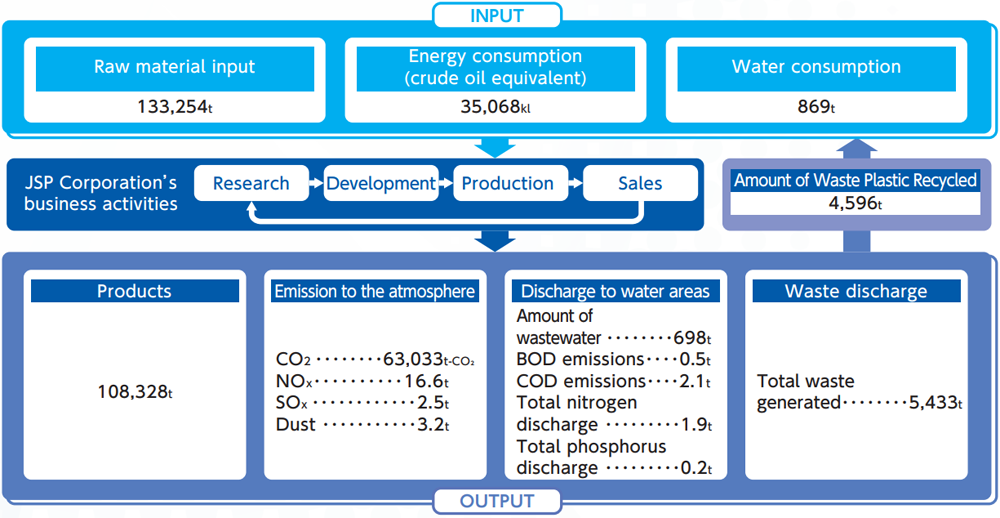
Input & Output (implemented in 2022)
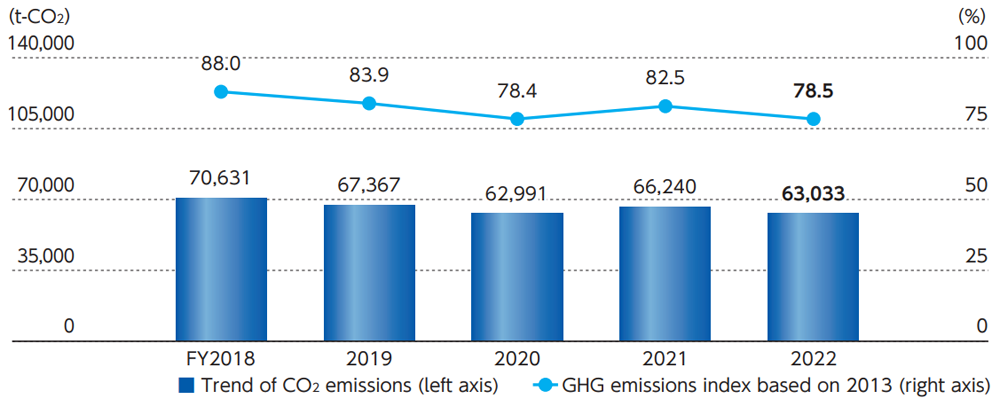
Reduction of CO2 Emissions
JSP Corporation's CO2 emissions in FY2022 decreased by approximately 4.8% (3,207 t-CO2 decrease) from the previous fiscal year. The main reasons for the improvement are the aggregation of plant operating days, effective use of waste heat, and our efforts toward reducing air leaks and heat-radiation loss in the plants. Compared to FY2013 values, emissions were reduced by approximately 21.5%.
Our foam material contributes to the reduction of greenhouse gas emissions in unseen areas of automobiles and homes, such as improving fuel efficiency when used in automobiles and improving heating and cooling efficiency when used as insulation in homes.
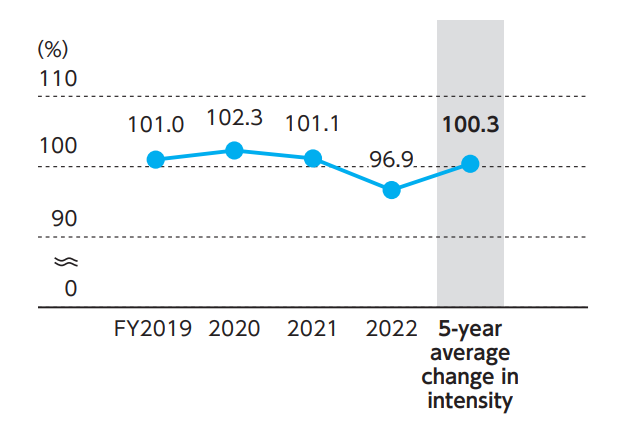
Reduction of Energy Consumption
In FY2022, JSP Corporation’s energy consumption per unit of production, calculated from the energy use contribution ratio*, improved to 96.9% compared to the previous year, achieving our goal of improving energy consumption per unit of production compared to the previous year. In addition, the average change in specific energy consumption per unit of production over the five-year period was 100.3%, and the goal of improving the average change in specific energy consumption per unit of production over the five-year period by an average of 1% or more per year was not achieved. From FY2023 onward, we will further implement the PDCA cycle for energy conservation activities at each business site and promote the introduction of green energy.
- *Contribution ratio method: Energy consumption intensity is calculated for each product group, and the ratio of energy consumption intensity of the entire businesses to that of the previous year is calculated in proportion to the ratio of the product group.

Challenge for modal shift
With the aim of environmental responsiveness, energy efficiency, and transportation stability in logistics, JSP Corporation is implementing modal shift to rail and ferry transportation, which emit less CO2 than truck transportation.
Modal shifts are also effective for safe and stable supply in the event of road disruptions due to natural disasters. It has a strong presence as a secondary or tertiary means of transportation. We will continue to actively engage in modal shift initiatives in cooperation with our business divisions.
Reduction of Water Usage
JSP Corporation carries out production activities using a water circulation system that recycles water without throwing it away in the manufacturing process. In FY2022, water consumption was lower than in FY2021 due to efficient use and thorough wastewater management at each plant.
Reduction of Landfill Amounts
In JSP Corporation's mid-term Responsible Care plan, we set a target for the final landfill amounts in FY2022 of "continuing to reduce landfill amounts (managing landfill amounts not to exceed the previous year's amounts)" and implemented systematic reduction activities at each business site. As a result, we were able to significantly decrease the amount compared to FY2021.
Maintenance Plan and the Results of Industrial Waste Treatment Facility (Incinerator)
Facility Name: Kanuma No. 2 Plant
Types of Treated Waste: Waste plastic
| Month/Year | Matters related to standards for facility description | Treatment facility operation status | Quantity of waste treated (t/month) | ||
|---|---|---|---|---|---|
| Combustion chamber measurement position | Furnace combustion chamber | ||||
| Measurement frequency | Continuous measurement | ||||
| Combustion chamber gas temperature (℃) | Dust collector inlet gas concentration (℃) | Exhaust gas carbon monoxide concentration (ppm) | |||
| Legal standard value | 800 higher | 200 lower | 100 lower | ||
| Maintenance standard value | 900 higher | 200 lower | 100 lower | ||
| April 2023 | Measurement result | 986 | 181 | 63 | 151.7 |
| Measurement date | April 13 | April 13 | April 13 | ||
| May 2023 | Measurement result | 1,000 | 181 | 35 | 127.1 |
| Measurement date | May 17 | May 17 | May 17 | ||
| June 2023 | Measurement result | 1,072 | 180 | 54 | 157.7 |
| Measurement date | June 15 | June 15 | June 15 | ||
| July 2023 | Measurement result | 1,072 | 183 | 42 | 152.5 |
| Measurement date | July 19 | July 19 | July 19 | ||
| August 2023 | Measurement result | 916 | 181 | 66 | 162.7 |
| Measurement date | August 17 | August 17 | August 17 | ||
| September 2023 | Measurement result | 1,060 | 183 | 42 | 146.6 |
| Measurement date | September 19 | September 19 | September 19 | ||
| October 2023 | Measurement result | 1,123 | 184 | 88 | 174.7 |
| Measurement date | October 17 | October 17 | October 17 | ||
| November 2023 | Measurement result | 948 | 182 | 49 | 166.2 |
| Measurement date | November 1 | November 1 | November 1 | ||
| December 2023 | Measurement result | 1,001 | 179 | 40 | 155.1 |
| Measurement date | December 21 | December 21 | December 21 | ||
| January 2024 | Measurement result | 987 | 177 | 81 | 134.9 |
| Measurement date | January 18 | January 18 | January 18 | ||
| February 2024 | Measurement result | 1,080 | 185 | 39 | 153.9 |
| Measurement date | February 15 | February 15 | February 15 | ||
| March 2024 | Measurement result | 1,039 | 185 | 39 | 156.5 |
| Measurement date | March 19 | March 19 | March 19 | ||
Facility Name: Kanuma No. 2 Plant
Types of Treated Waste: Waste plastic
| Month/Year | Matters related to exhaust gas concentration (* 12% enzyme conversion value) | Quantity of waste treated (t/month) | |||||
|---|---|---|---|---|---|---|---|
| Exhaust gas sampling location | Chimney after dust collector | ||||||
| Measurement frequency | Measured twice a year | Measured twice a year | Measured twice a year | Measured twice a year | Measured once a year | ||
| Dust concentration * (g / Nm3) | Nitrogen oxide concentration * (ppm) | Amount of sulfur oxides (m3N / h) | Amount of hydrogen chloride (mg / Nm3) | Dioxins concentration | |||
| Legal standard value | 0.15 lower | 250 lower | 4.8 lower | 700 lower | 5 lower | ||
| Maintenance standard value | 0.05 lower | 30 lower | 0.069 lower | 50 lower | 0.3 lower | ||
| October 2022 | Measurement result | 0.005 | 29 | Less than 0.014 | 11.0 | - | 173.7 |
| Measurement date | October 18 | October 18 | October 18 | October 18 | - | ||
| Reported date of measurement | October 26 | October 26 | October 26 | October 26 | - | ||
| March 2023 | Measurement result | 0.041 | 29 | Less than 0.014 | Less than 3.3 | 0.000016 | 170.8 |
| Measurement date | February 3 | February 3 | February 3 | February 3 | February 3 | ||
| Reported date of measurement | March 13 | March 13 | March 13 | March 13 | March 13 | ||