
Financial Highlights
Consolidated
(millions of yen)
| 2020/3 |
2021/3 |
2022/3 |
2023/3 |
2024/3 |
|
|---|---|---|---|---|---|
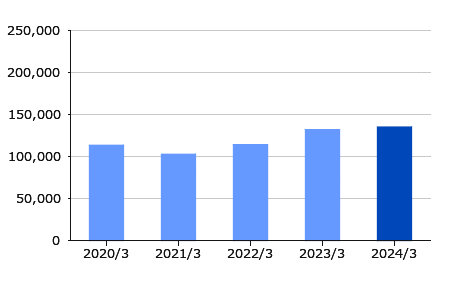
| Net sales | 113,375 | 102,668 | 114,125 | 131,714 | 135,051 |
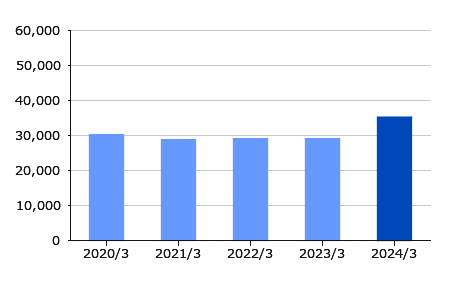
| Gross profit | 30,167 | 28,726 | 29,058 | 29,089 | 35,248 |
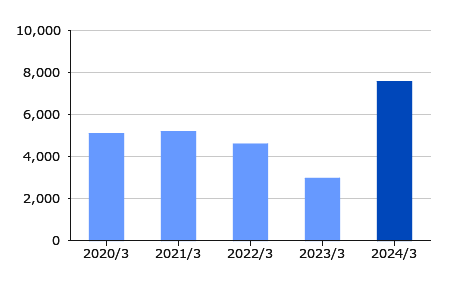
| Operating profit | 5,083 | 5,185 | 4,589 | 2,956 | 7,563 |
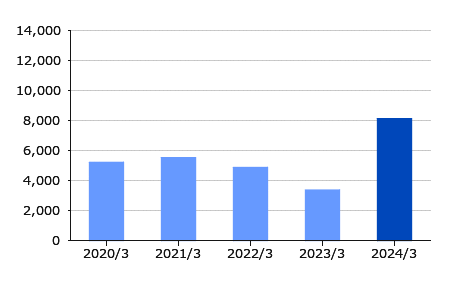
| Ordinary profit | 5,210 | 5,519 | 4,868 | 3,363 | 8,127 |
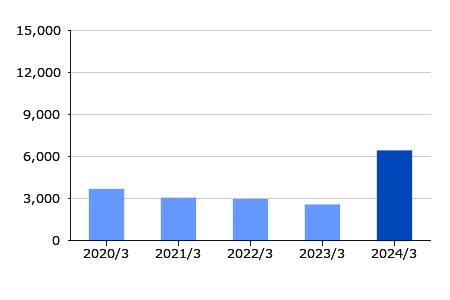
| Profit attributable to owners of the parent | 3,638 | 3,017 | 2,893 | 2,531 | 6,391 |
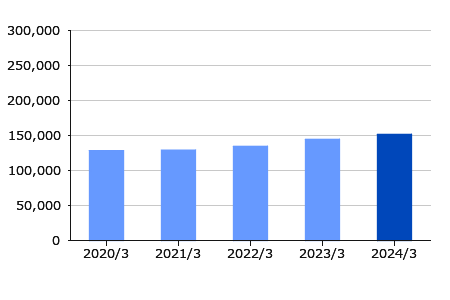
| Total assets | 128,445 | 129,053 | 134,527 | 144,528 | 151,605 |
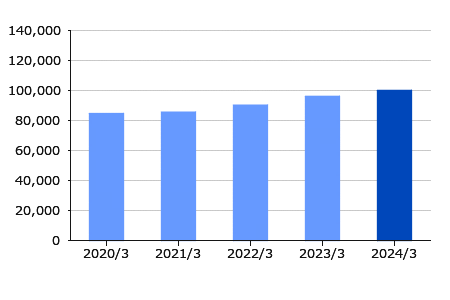
| Net assets | 84,646 | 85,561 | 90,231 | 96,123 | 100,069 |

